
2026 State of the Team report
Most teams work in ways that differ from what members prefer. Explore the findings and choose one working agreement to improve with your team.
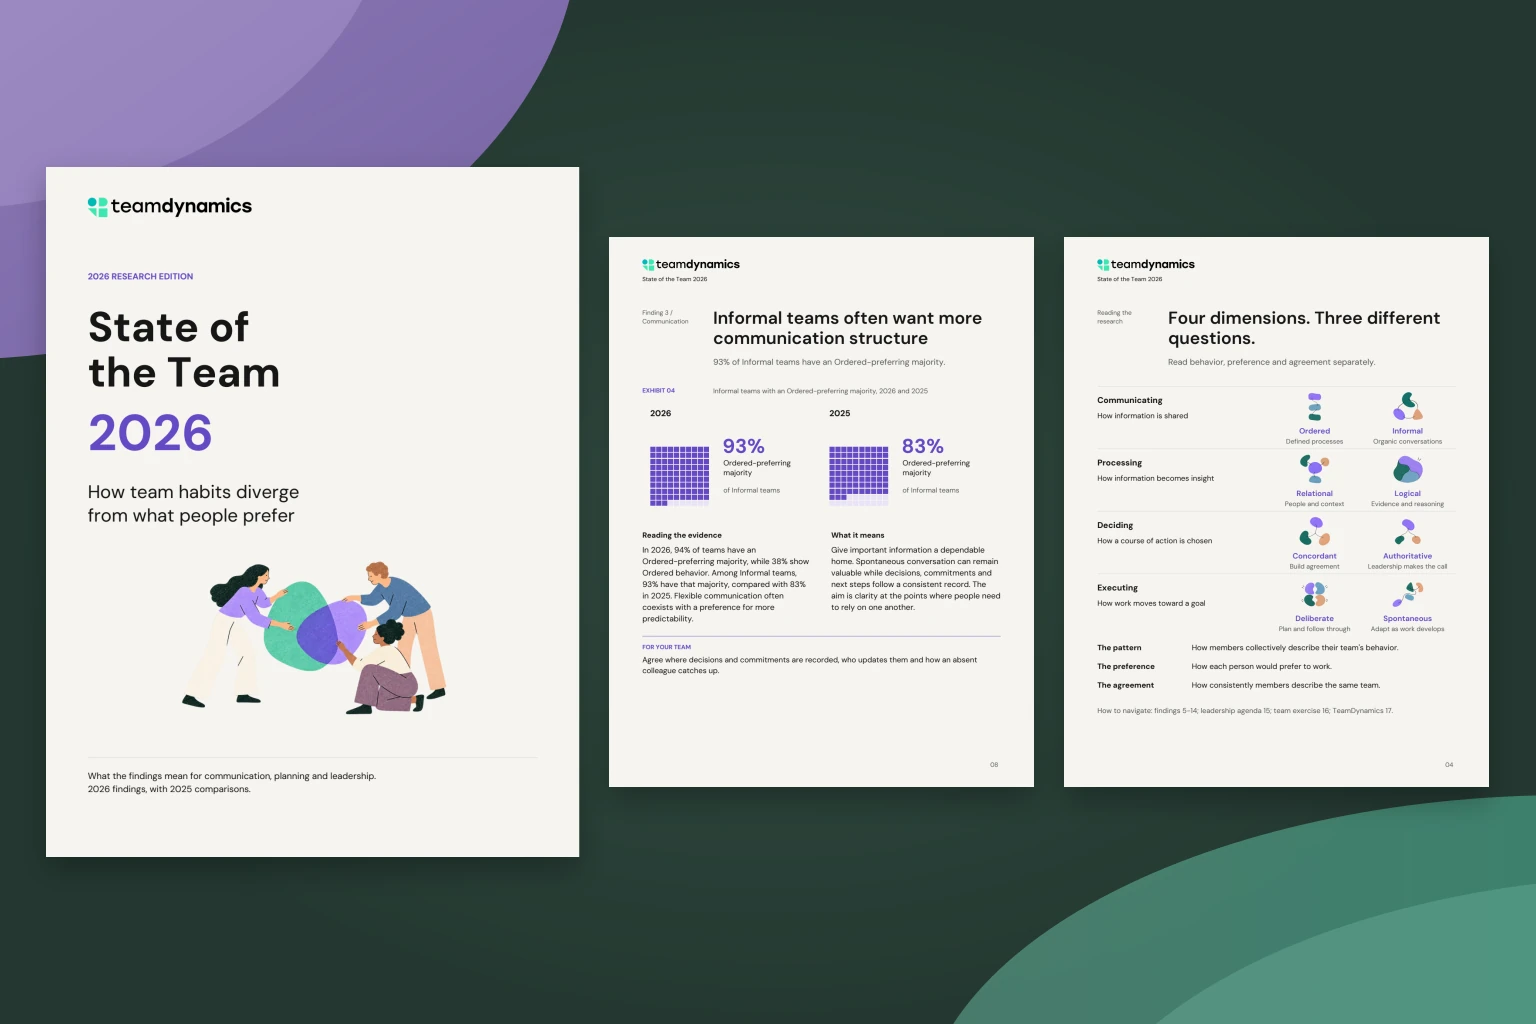
Get the 2026 team report
Free PDF download.
TL;DR
2026 findings with 2025 comparisons, a leadership agenda and a 20-minute exercise for your team.
On 91% of teams, a majority prefer a different approach from at least one established team behavior. The 2026 State of the Team makes that gap visible and identifies practical priorities for leaders.
The report examines communication, planning, decisions and shared perceptions. Use the findings to review one routine, hear members' experiences and agree what to try next.
Team habits differ from what people prefer
In both years, people are more likely to prefer Ordered communication and Deliberate execution than teams are to work that way. Decision-making shows the reverse: Concordant team behavior is more common than the individual preference for it.

These comparisons establish the broad pattern. Comparing each person with their own team reveals where adaptation is required and whether the gap affects a few members or most of the group.
Most people adapt on several fronts
Working-style differences rarely fit a single label. A person may favor the team's decision process while finding its communication or planning less natural. A third of 2026 team-member results show differences on three or four dimensions.

The 2025 results show the same broad pattern. Leaders should locate the specific routine that requires effort: an update, a decision or a handoff. That gives the team a concrete starting point for change.
The gap is often collective. On 51% of teams, a majority prefer the opposite pole on at least two dimensions. Established routines can persist even when most members would choose a different approach.
For your team: Review one established norm. Clarify its purpose, hear members' preferences and choose whether to keep, adapt or replace it.
Download the full report for the dimension-level comparison and a practical team discussion exercise.
Communication and planning offer concrete places to start
In 2026, 94% of teams have an Ordered-preferring majority, while 38% show Ordered behavior. Among Informal teams, 93% have that majority, compared with 83% in 2025. Flexible communication often coexists with a preference for more predictability.

Give important information a dependable home. Spontaneous conversation can remain valuable while decisions, commitments and next steps follow a consistent record. The aim is clarity at the points where people need to rely on one another.
For your team: Agree where decisions and commitments are recorded, who updates them and how an absent colleague catches up.
More than three quarters of Spontaneous teams have a majority who prefer Deliberate execution. Across the people assessed, 73% prefer Deliberate execution. Many people want a clearer path even when their team adjusts as work unfolds.

Set a stable next commitment and keep the route open to revision. A useful plan identifies the deliverable, owner and review date, plus the new information that would justify a change.
For your team: Define the next deliverable, its owner and a review date. Agree what would trigger a change of plan.
Your TeamDynamics rapid result · 2 minutes
What makes your team tick?
Answer twelve quick questions about how your team works, then enter your email to see your free TeamDynamics preview.
When we have team meetings…
Question 1 of 12 · Choose an answer to startTeam members experience the same routines differently
On 94% of teams, members describe both poles on at least two dimensions. People enter the conversation with different accounts of how the team already works, as well as different preferences for what should change.

Start with recent examples. Ask which projects, relationships or situations shaped each account. The team profile gives the discussion a common reference; those examples show where the experience varies.
Pattern strength and agreement answer different questions. A pronounced shared tendency can still include members who describe the opposite style. Across the four dimensions, 55% of very strong classifications contain descriptions on both sides.
For your team: Ask everyone for a recent example. Identify where the pattern holds, where it changes and whose experience needs closer attention.
Managers need to test their assumptions about the team
Managers match all four team styles in 27% of results, close to 28% for other members. Communication is the largest gap: 38% of manager descriptions differ from the overall team style, compared with 22% in 2025.
Preferences differ too: 58% of manager results favor Ordered communication, compared with 77% of other member results. Leaders need to hear what members need from a routine before choosing the approach everyone will use.
For managers: State your own preference, invite members to share theirs and agree what the work requires.
Examine communication, planning and decisions together
In 2026, 67% of Ordered teams execute Deliberately, compared with 17% of Informal teams: a 3.9-fold difference. The corresponding 2025 shares are 67% and 11%. Communication and execution show a clear association in both years.

For leaders, the practical question is how information becomes a commitment. The personal results connect these topics too: 38% show preference differences in both Communicating and Executing. Review the update, plan and handoff together to identify a working agreement worth improving.
In 2026, 85% of teams show Logical processing and 66% show Concordant decisions. More than half combine both: they emphasize facts and analysis while seeking agreement on the decision.

Within Concordant teams, 45% have an Authoritative-preferring majority. A consensus norm can coexist with a preference for a designated decision-maker. Leaders should specify which decisions require agreement and who makes the final call in each case.
For your team: For one recurring decision, name who provides evidence, who is consulted and who makes the final call.
Make one working agreement explicit
Choose a recent update, decision or handoff. Compare current practice with members' experiences and preferences. Agree one experiment, give it an owner and set a review date. The report includes a 20-minute exercise and a worked example.
TeamDynamics gives your team a shared language. The team profile and facilitation presentation guide the discussion; private CoDynamics insights connect each person's preferences to the team pattern.
Most people complete the assessment in 10-15 minutes; allow up to 30. The team gets a shared profile. Each participant receives private CoDynamics insights; authorized managers receive coaching guidance. Use the Team Discussion Guide to lead the conversation.
See what your team would receive, or explore pricing for your team.
Start with the free report. The 18-page edition includes an executive perspective, eight findings, a leadership agenda, ten exhibits and a team exercise.
Frequently asked questions
Questions, answered.
What does the 2026 State of the Team report cover?
The report explores team behavior, individual working preferences and members’ perspectives, with charts, a leadership agenda and a 20-minute team exercise.
What can differences in working preferences reveal?
They show where people adapt to established team habits. Use a recent update, decision or handoff to explore what members need, then agree one change to try.
How can I use the findings with my team?
Start with the report's 20-minute exercise: describe a recent example, surface preferences, choose one small experiment and set a review date. To examine your own team's pattern, explore the sample TeamDynamics outputs and the team assessment.
What will I receive when I download the report?
An 18-page PDF with the findings, charts, leadership agenda and a team discussion exercise.
Keep building
More free tools for your team.
2024 State of the Team report
Explore the 2024 TeamDynamics research on working preferences, team behavior and managers’ perspectives, with charts and a practical planning exercise.
Open free resource
2025 State of the Team report
Explore the 2025 TeamDynamics research on working preferences, team behavior and managers’ perspectives, with charts and a practical planning exercise.
Open free resource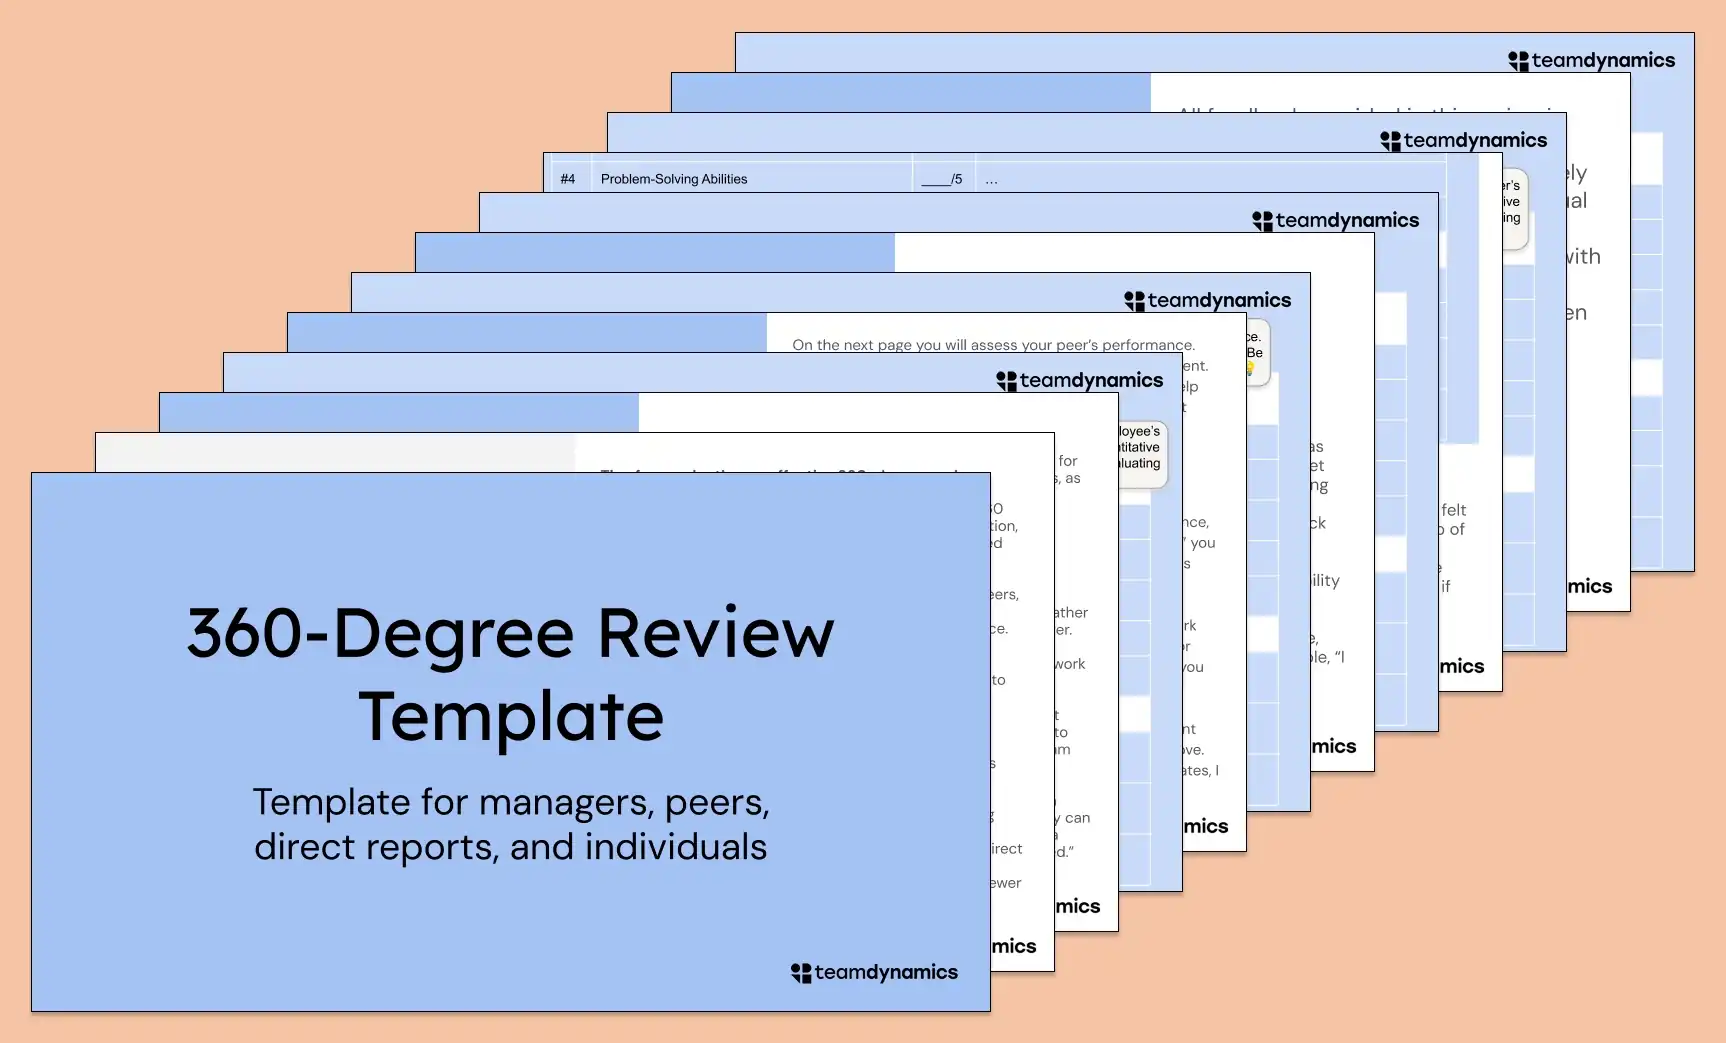
360-Degree Review Template and Guide for Managers, Peers and Individuals
Use a free 360-degree review template for manager, peer, self, and upward feedback. See worked feedback examples, preparation steps, and a follow-up record.
Open free resource